About this time last year I posted an entry where I detailed my ideas for using the Samsung SmartThings ecosystem to get hold of my home’s Gas and Electrical usage data. Since then I have developed a simple SmartThings App which achieves this, so thought I’d share the details.
SmartThings
SmartThings provides its users with the ability to write “SmartApps”. A SmartApp is essentially a Groovy script, which is written in the SmartThings Groovy IDE and implements various methods, providing access to various functionality.
A basic SmartApp looks something like this:
// The SmartApp definition.
definition(
    name: "MyFirstSmartApp",
    namespace: "eddgrant",
    author: "Edd Grant",
    description: "Subscribes to foo events and does bar on receipt of an event",
    category: "Fun Stuff",
    iconUrl: "https://s3.amazonaws.com/smartapp-icons/Convenience/Cat-Convenience.png"
)

preferences {
    // Provides the ability to configure the app's parameters and inputs.
    section("A parameter") {
        input "parameterOne", "string", required: true, title: "The first parameter"
    }
}

def installed() {
    // Gets called when the app is installed.
    initialize()
}

def updated() {
    // Gets called when the app is updated.
    unsubscribe()
    initialize()
}

def initialize() {
    // Perform initialising behaviours
}
Event Handlers
Additionally SmartApps can subscribe to various event types which exist within the SmartThings environment. Events are emitted by “devices”, which can be either physical or virtual. As such the catalogue of available Event types is continually increasing as third parties add new devices to the SmartThings ecosystem, integrating their services.
Subscribing a SmartApp to certain events is easy and can be achieved by simply calling the provided subscribe() function, passing in the details of an event type and the SmartApp method which should handle events of that type e.g.
def initialize() {
    // Register functions which to be triggered on event subscriptions.
    subscribe(someThing, "someEventType", myEventPublishedHandler)
}

def myEventPublishedHandler(evt) {
    // Event handler function.
    log.debug("someThing event - event.value: $evt.value")
}
A Map containing any associated event data is passed in to the event handler method.
Bulb SmartThings Energy Controller
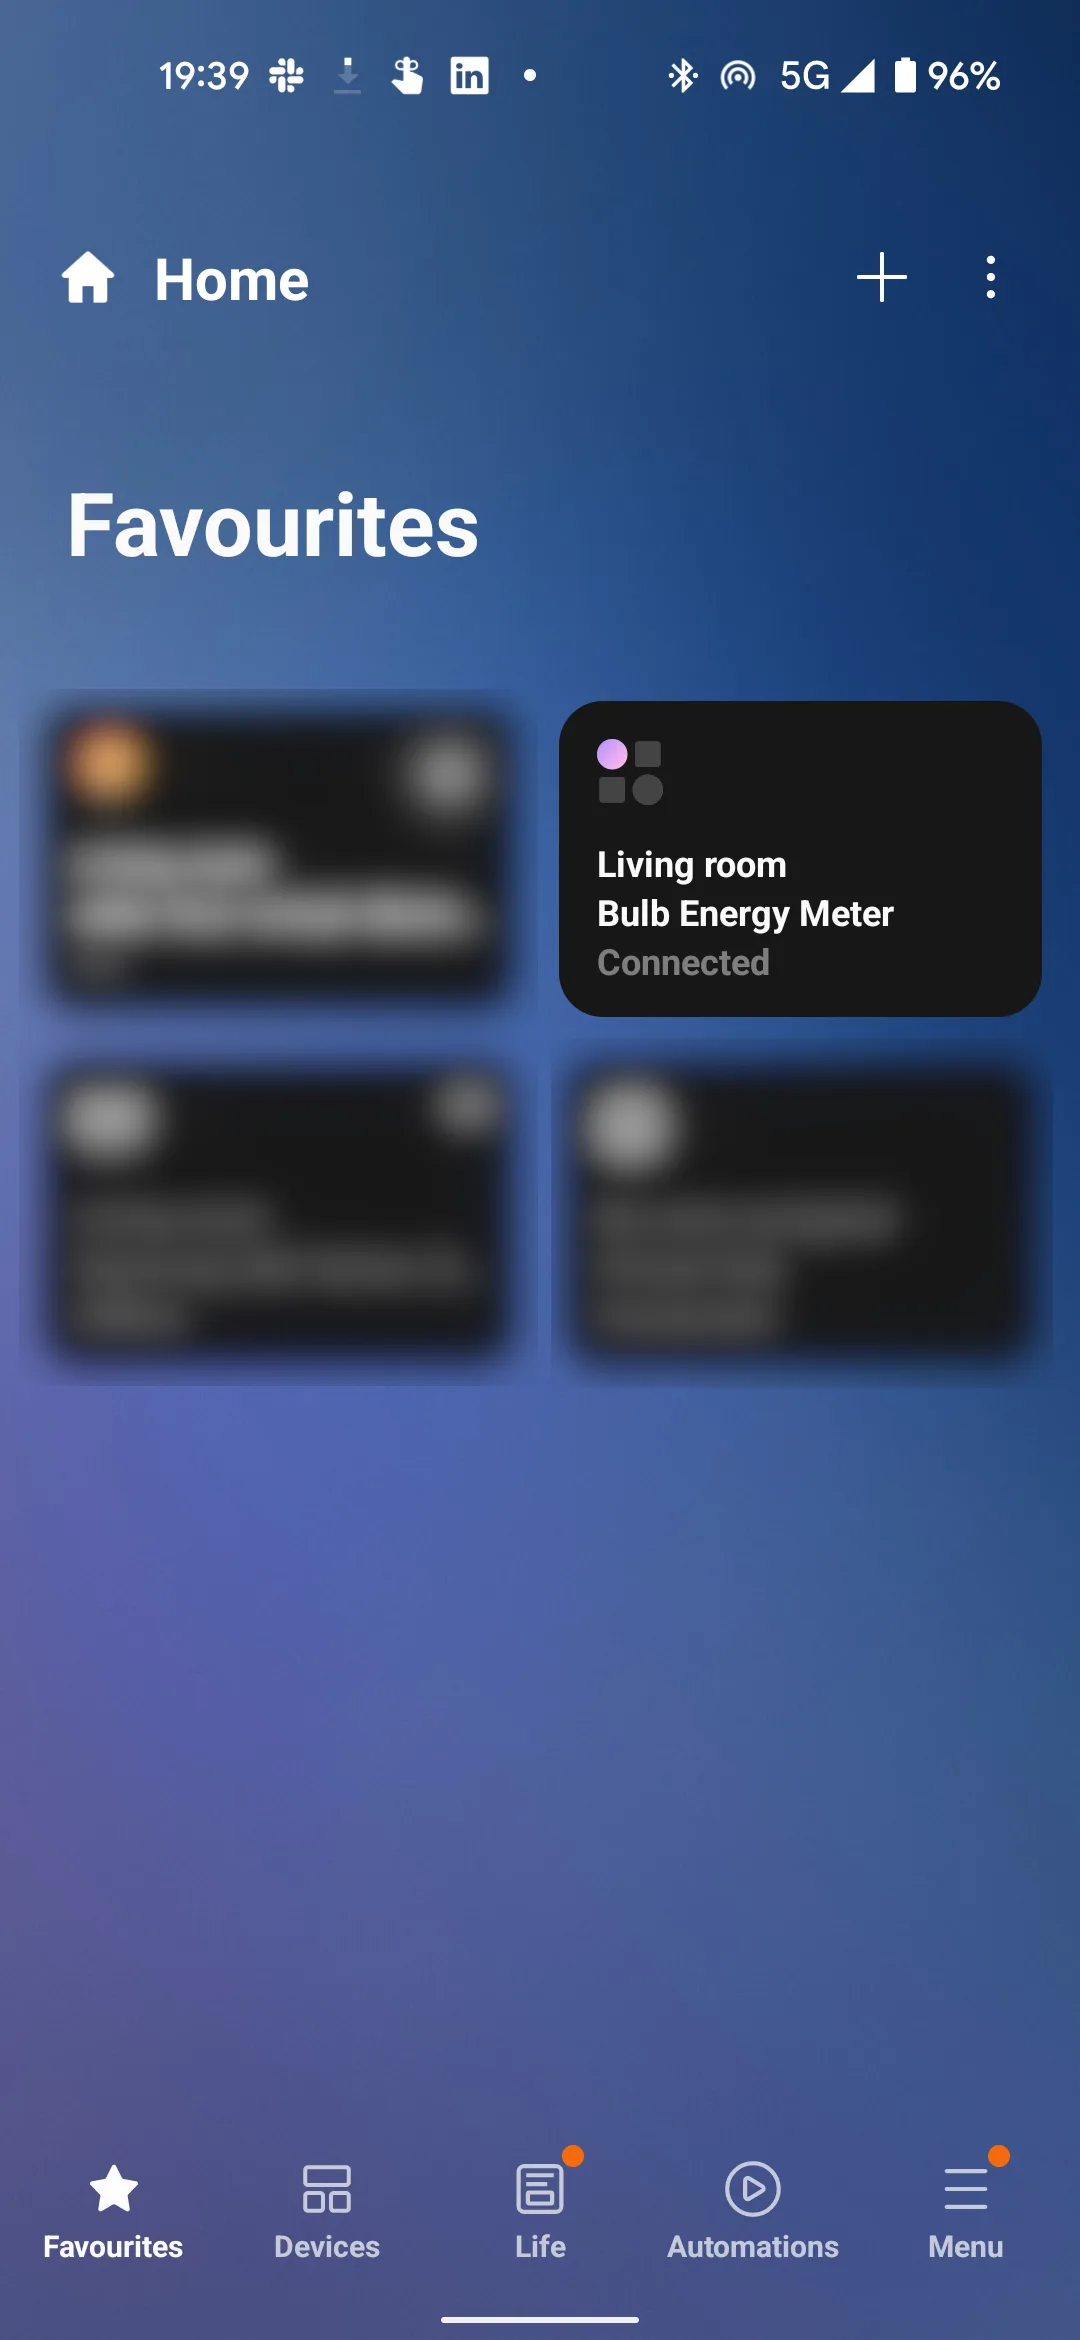
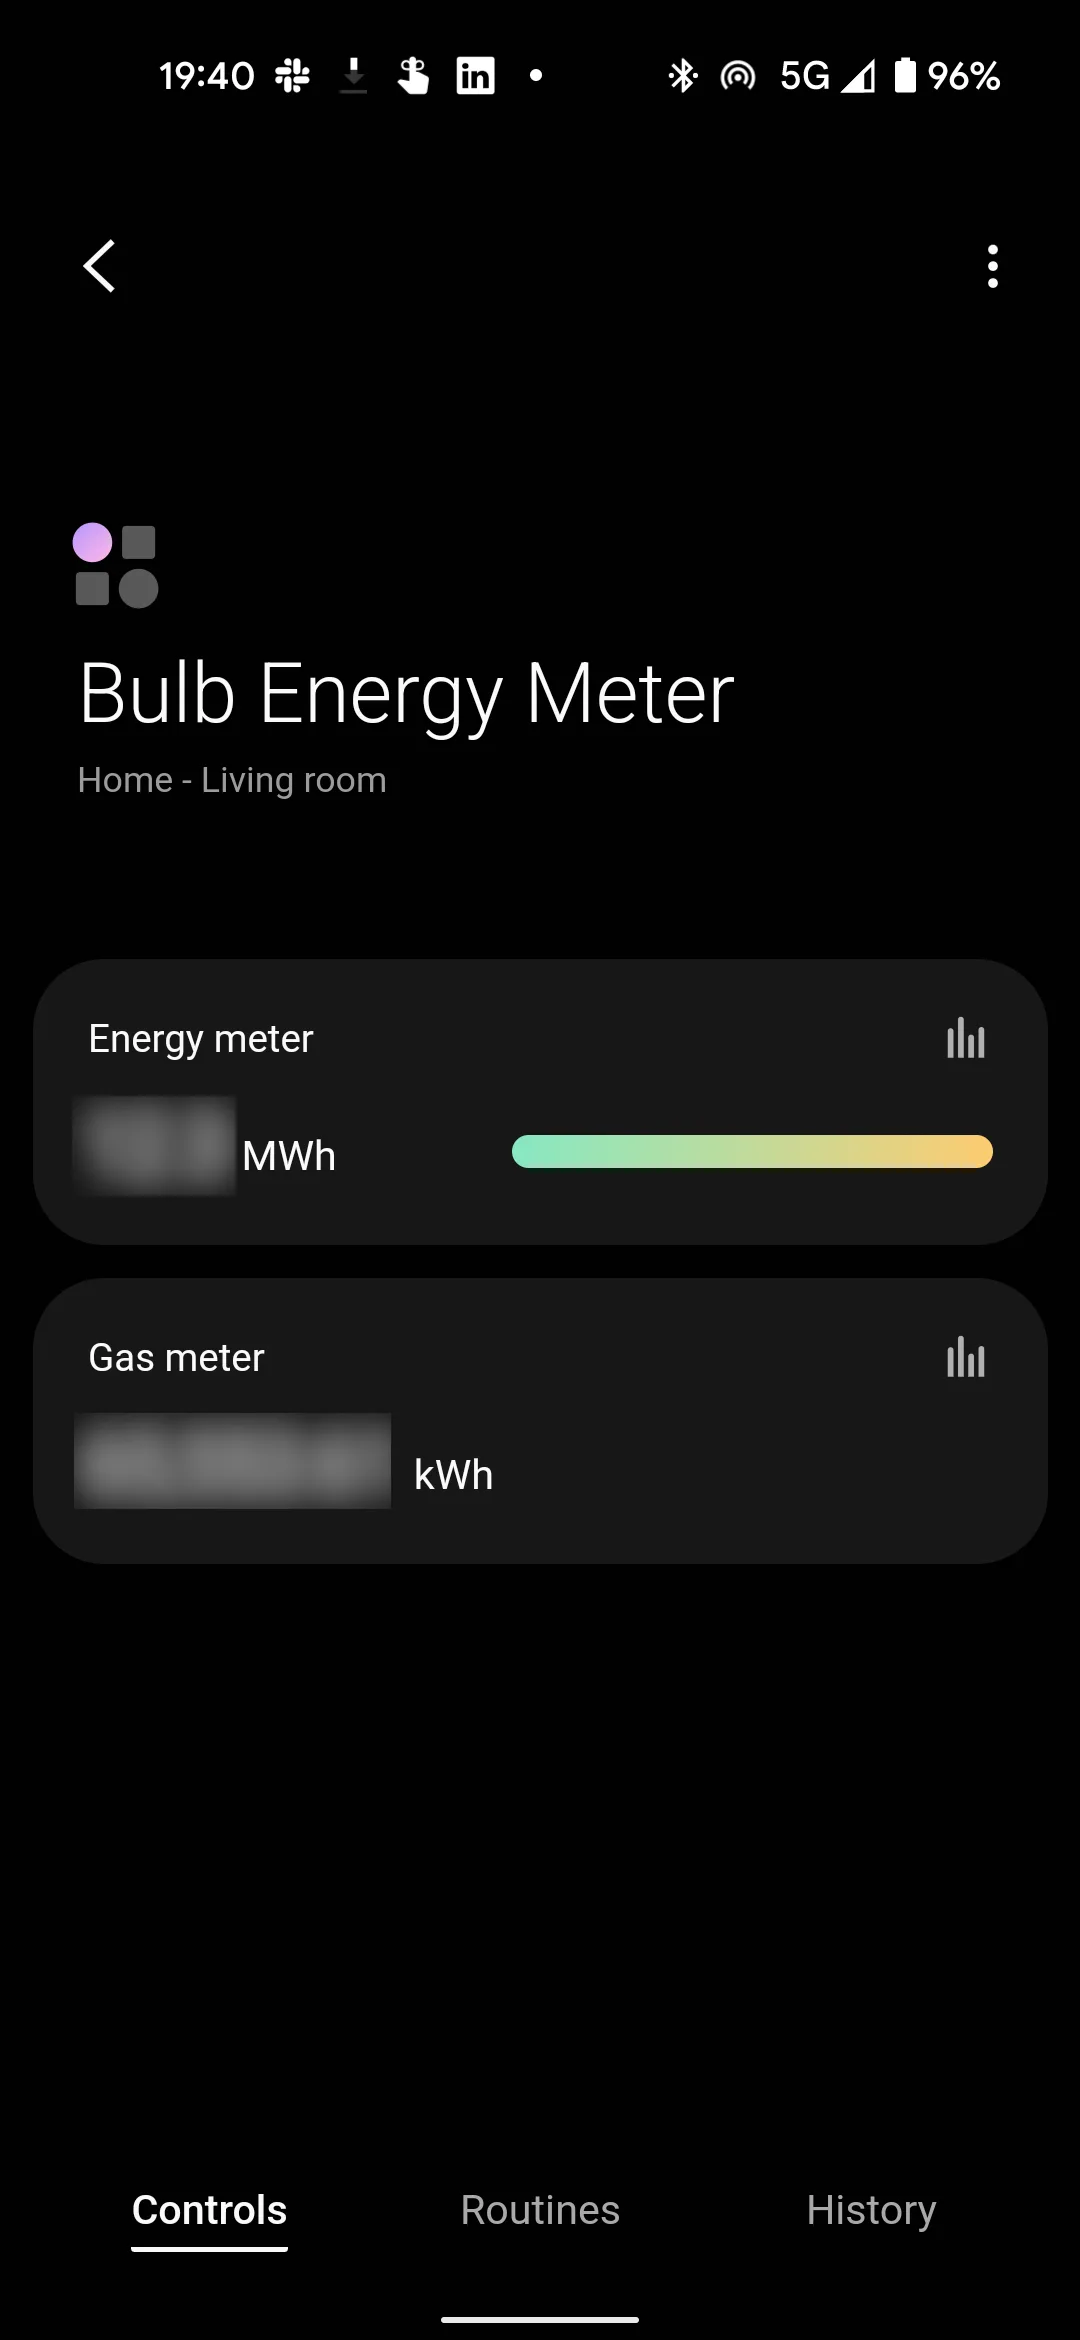
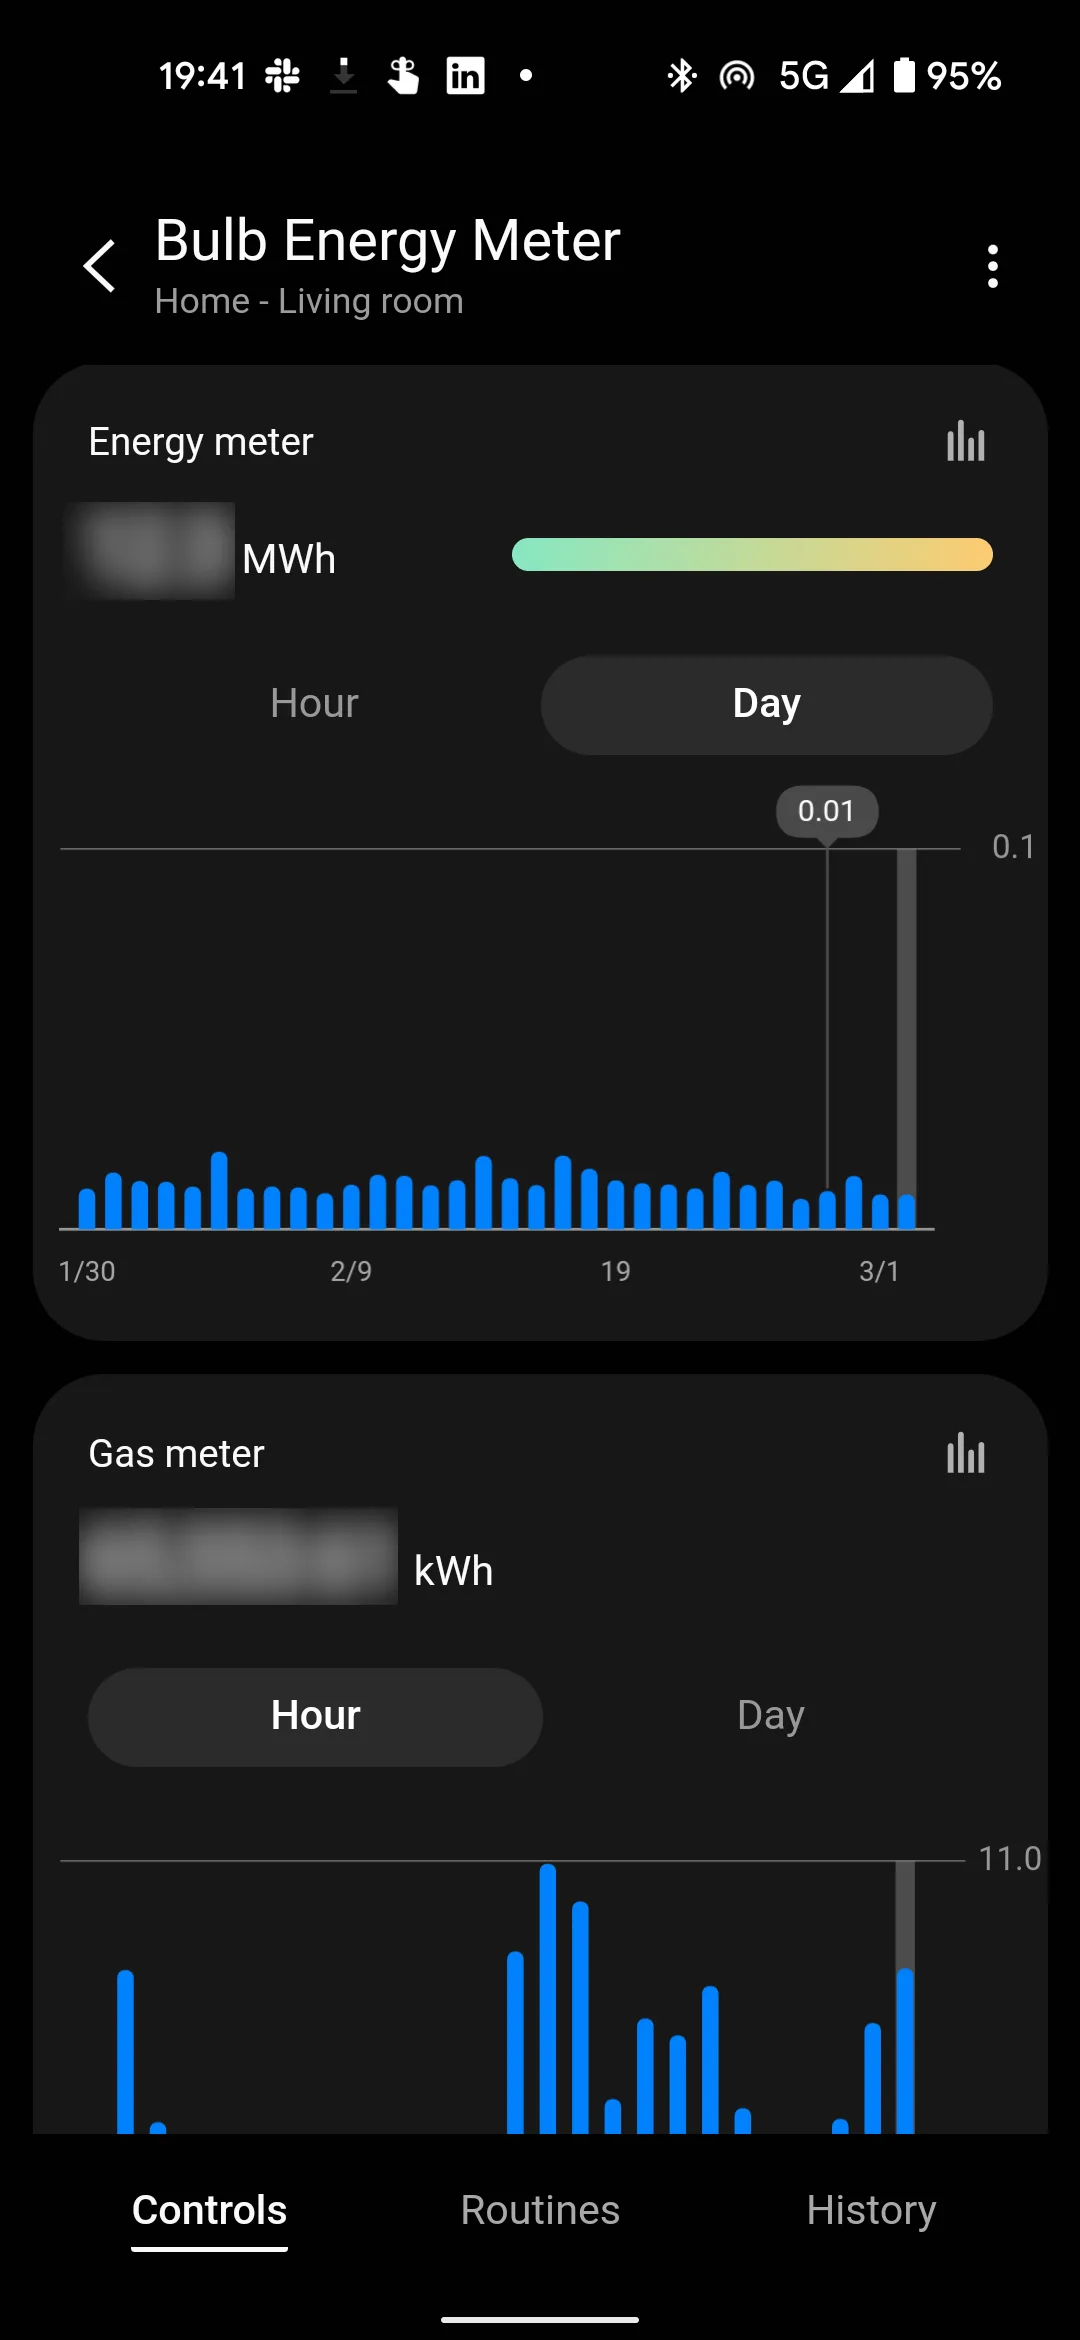
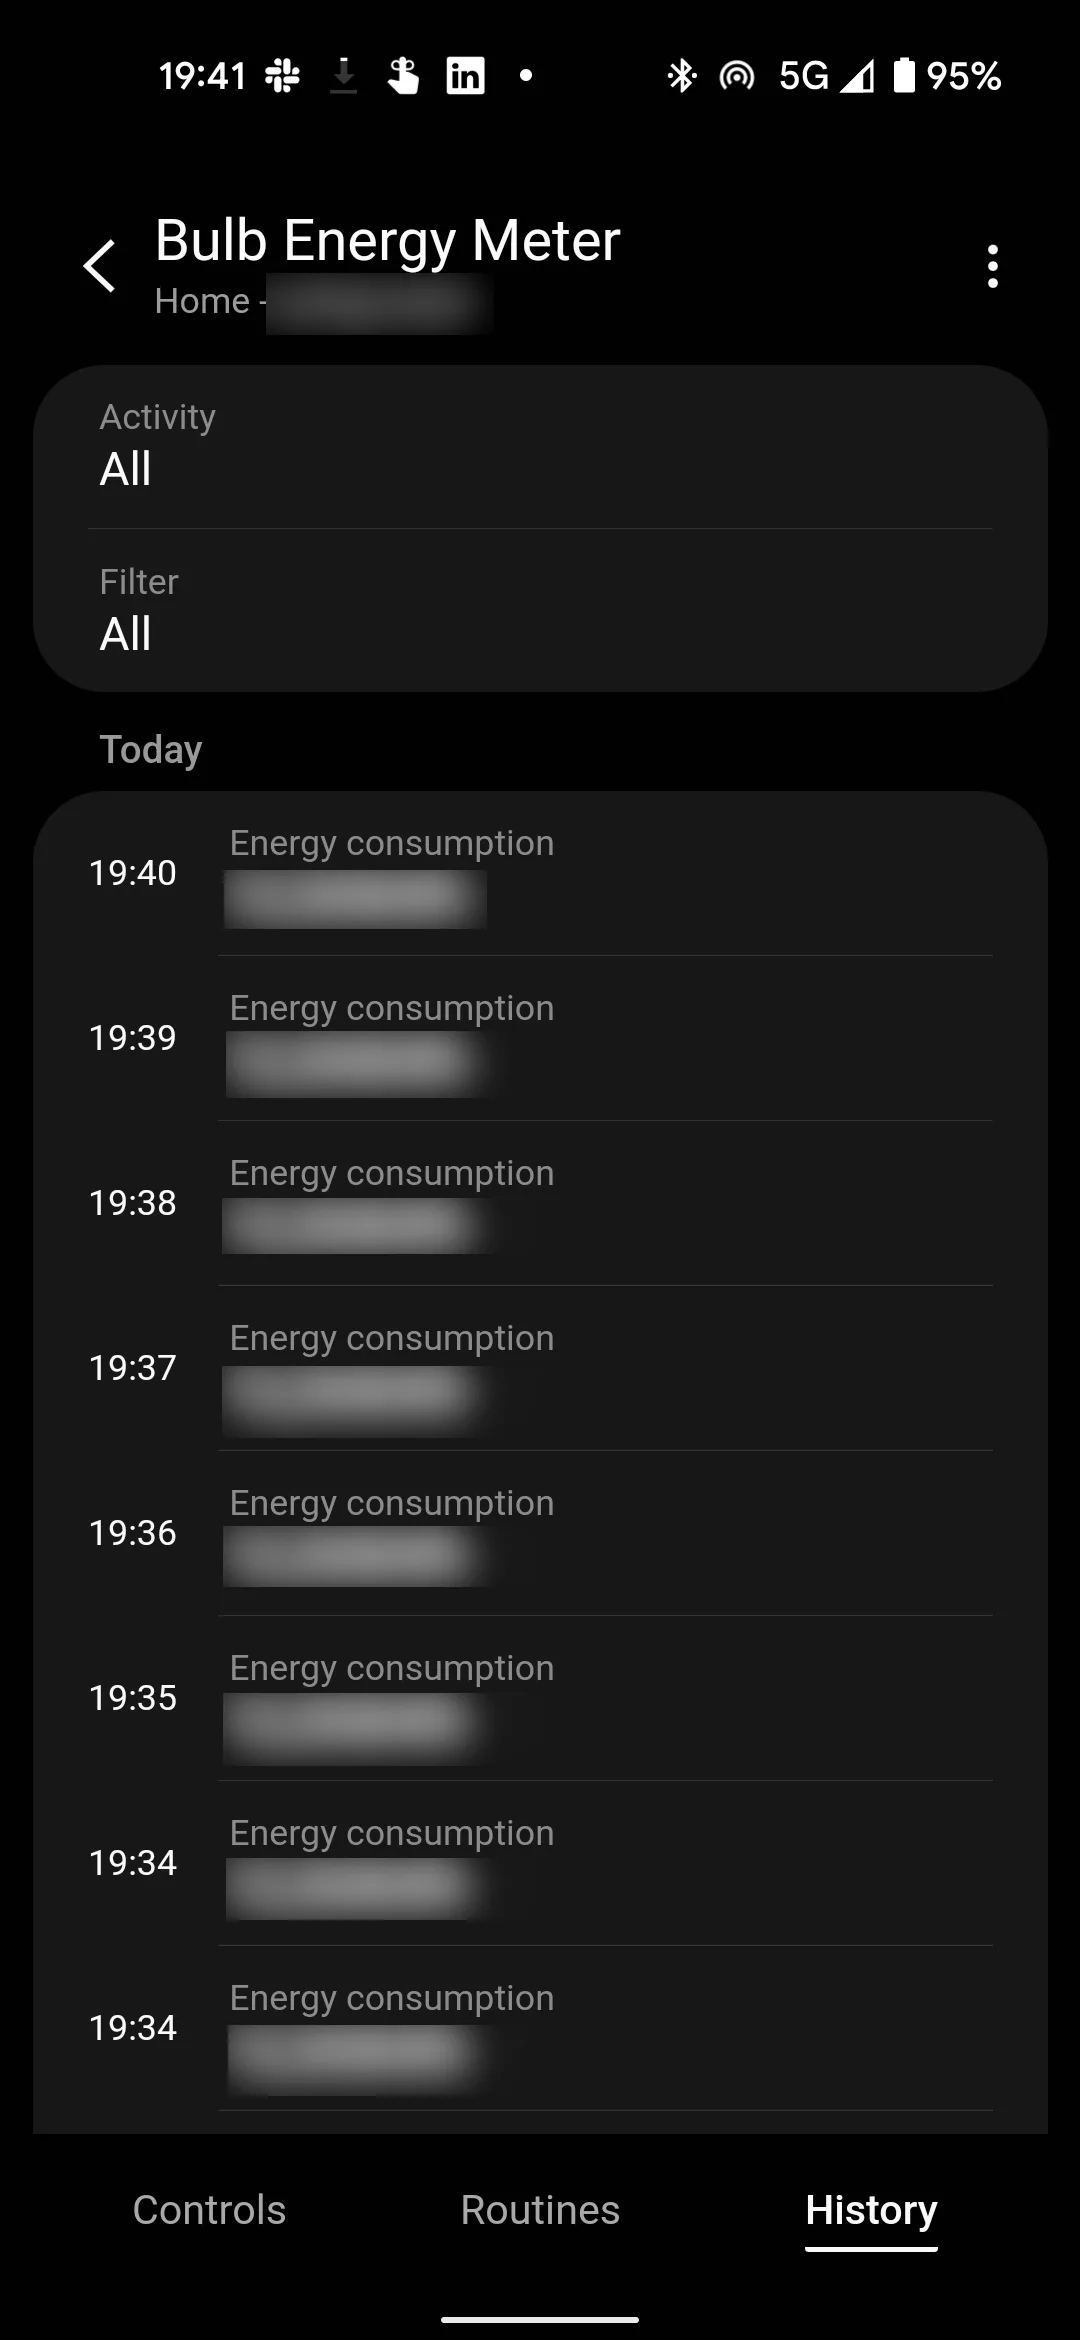
My energy supplier Bulb, have implemented a SmartThings app called the Bulb SmartThings Energy Controller (STEC). The STEC app registers a virtual device in your SmartThings account which obtains the energy usage data from your gas and electrical smart meters and makes them available in the SmartThings app on your phone.
Here are some of the screens from the STEC SmartThings app.
Note: Despite Bulb using the name “Bulb SmartThings Energy Controller” in various bits of documentation the SmartThings app refers to itself as “Bulb Energy Meter”.
Having installed the STEC app, I did a bit of poking around and discovered that it emits 2 types of events for consumption within the SmartThings ecosystem: energy and gasMeter. These sounded like just what I was after so I decided to try and consume them in my own SmartApp.
SmartApp Design
The design is pretty straight forward; essentially it boils down to:
- Write a basic SmartApp
- configure the SmartApp to subscribe to
energyandgasMeterevents from the STEC app. - Write handler functions for each event type to export them to my InfluxDB Database.
- Write a Grafana Dashboard which queries the data from InfluxDB.
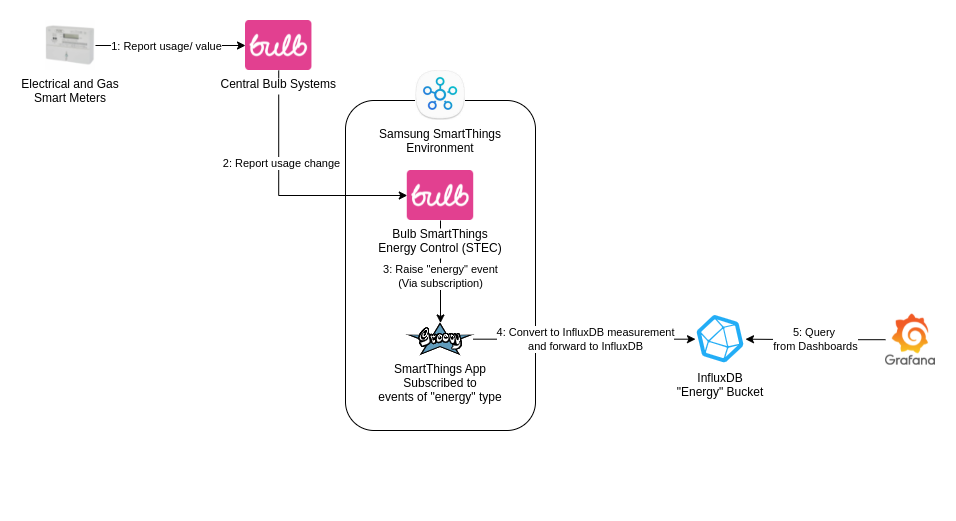
The diagram below shows the intended data flow:
Define SmartApp Inputs
I defined the configurable aspects of the SmartApp by defining some inputs in the preferences closure:
preferences {
    section("BulbEnergyPublisher") {
        input "bulbEnergyMonitor", "capability.energyMeter", required: true, title: "Select your Bulb Energy Monitor"
    }
    section("InfluxDB API") {
        input "metricsEndpoint", "string", required: true, title: "InfluxDB API Endpoint."
        input "influxDBOrgName", "string", required: true, title: "InfluxDB Organisation Name."
        input "influxDBBucketName", "string", required: true, title: "InfluxDB Bucket Name."
        input "influxDBAuthorisationHeader", "string", required: true, title: "InfluxDB Authorisation Header."
    }
}
This allows the user to select their virtual bulb smart meter device and to provide the app with the necessary details to send data to an InfluxDB API endpoint, when installing the SmartApp.
Having added the above code to the SmartApp I ran it in the SmartThings IDE simulator, which presented me with the following screen:
This provides the mechanism for selecting my Bulb virtual energy meter and configuring the InfluxDB endpoint details.
Define Event Subscriptions
The next task was to subscribe to the energy (Electrical) and gasMeter events. To do this I defined a very simple event handler method for each type of event:
def gasEventPublishedHandler(evt) {
    log.debug("gasMeter event - event.value: $evt.value")
}

def energyEventPublishedHandler(evt) {
    log.debug "Energy event - event.value: $evt.value"
}
Having defined the methods I then used the initialise method (which is called when the SmartApp is first started) to set each method up as the event handler for its associated event type.
Note that the thing we’re subscribing to here, the bulbEnergyMonitor, is the Bulb Energy Meter identified in the preferences section above:
def initialize() {
    subscribe(bulbEnergyMonitor, "energy", energyEventPublishedHandler)
    subscribe(bulbEnergyMonitor, "gasMeter", gasEventPublishedHandler)
}
Looking at the event data
Using the simulator I clicked the “Install” button. At this point I could see the following in the logs:
Energy event - event.value: 12363.6
Great news - this was confirmation that I had successfully received an energy event! I was keen to find out if the event contained any other data, specifically a timestamp so I could use that rather than having to rely on the current time, which might skew my data.
A bit of scratching around showed me that both event types had the following properties
| Property Name | Property Type | Property Purpose | Example Value |
|---|---|---|---|
date |
java.util.Date |
Provide the date/ time of the event. | Fri Mar 11 08:22:17 UTC 2022 (parsed) |
location |
String |
This seems to be the SmartThings “location” with which the Bulb STEC app is associated. | Home |
name |
String |
The name of the event type. | energy (for electrical events) or gasMeter |
numericValue |
??? | The current, numeric, meter reading at the time of the event. | 12363.62 |
source |
String |
The source of the event. | Value is always DEVICE |
unit |
String |
The unit type associated with the numericValue event property. |
Value is always kWh |
digital |
boolean |
Not sure what this represents. | Value is always false |
physical |
boolean |
Not sure what this represents. | Value is always false |
stateChange |
boolean |
Whether the event represents a change in state or not. | Value is always true |
Sending Events to InfluxDB
Having discovered the event properties I felt like each event contained an adequate set of information to generate some meaningful graphs and dashboards. The next challenge was to see how I could get the data out of the SmartThings ecosystem and in to my own system.
As the eagle eyed amongst you may have noticed, the parameters I configured above provide an endpoint and authentication details to an InfluxDB endpoint. I configured an energy Bucket in my InfluxDB system, created a dedicated access token for this application, which had write access to the energy Bucket and configured the InfluxDB details in the Smart App parameters.
Disclaimer: For the purposes of this project I decided to make an InfluxDB endpoint available on the internet. The transport is encrypted and it uses a dedicated token, which follows the principle of least privilege. However this is not an approach I would recommend for anything other than a toy setup such as this. Please do consider your own data security needs if you choose to implement this yourself.
Convert Events to InfluxDB Line Protocol
The next thing to do was to write a function which extracted the data of interest from each event and converted it to an InfluxDB measurement in line protocol format:
def asInfluxDbLineProtocol(event) {
    log.debug("Event Name: ${event.name}")
    def measurementName = null
    if(event.name == "energy") {
        measurementName = "electricity"
    }
    if(event.name == "gasMeter") {
        measurementName = "gas"
    }

    log.debug("Measurement Name: ${measurementName}")
    final String epochInMilliseconds = event.date.time
    final String line = """${measurementName},location=${event.location},source=${event.source},unit=${event.unit},digital=${event.digital},physical=${event.physical} value=${event.numericValue} ${epochInMilliseconds}"""
    log.debug("Line: ${line}")
    return line
}
Finding an HTTP transport
Having the event in line protocol format the final task was to send the data over to InfluxDB. This took a little bit of head scratching and I wondered if SmartThings might protect against outbound internet access to protect from data exfiltration. However I eventually discovered that the SmartThings environment provided an httpPostJson method, which I was able to use to send the data to InfluxDB:
def publishEvent(evt) {
    debugEvent(evt)
    def data = parseJson(evt.data)

    def uri = "${metricsEndpoint}?bucket=${influxDBBucketName}&org=${influxDBOrgName}&precision=ms"
    log.debug("URI is: ${uri}")
    def params = [
        uri: uri,
        body: asInfluxDbLineProtocol(evt),
        headers: [Authorization: influxDBAuthorisationHeader]
    ]
    try {
        httpPostJson(params) { resp ->
            log.debug "HTTP request made to ${metricsEndpoint}. Response status code: ${resp.status}"
        }
    } catch (e) {
        log.error "Unable to make HTTP Request: ${e}"
    }
}
The logs confirmed that InfluxDB was responding with a 204 status code, suggesting that data was making its way in to InfluxDB:
23f2cc7e-9af5-4d11-afaa-fe4ff0eeb643 07:46:32: debug HTTP request made to https://<redacted>. Response status code: 204
Visualising the Data
Gas
I wanted to be able to aggregate the readings on certain time intervals (per hour, per day, per month etc). After a bit of fiddling I came up with the following Flux query which allowed me to configure the aggregation easily:
from(bucket: "energy/autogen")
  |> range(start: v.timeRangeStart, stop: v.timeRangeStop)
  |> filter(fn: (r) => r["_measurement"] == "gas")
  |> aggregateWindow(every: 1h, fn: last, timeSrc: "_start", timeDst: "_time", createEmpty: false)
  |> difference(nonNegative: false, columns: ["_value"])
  |> keep(columns: ["_time", "_value"])
  |>rename(columns: {_value: "Gas"})
Our main usage of Gas is our central heating, I thought it might be interesting to see if/ what the relationship is between the outside temperature and our gas usage so added an additional Flux query to overlay the add the outside temperature as second series on the graph:
from(bucket: "domoticz/autogen")
  |> range(start: v.timeRangeStart, stop: v.timeRangeStop)
  |> filter(fn: (r) => r["_measurement"] == "Temperature")
  |> filter(fn: (r) => r["name"] == "DarkSky-Weather-Data")
  |> aggregateWindow(every: v.windowPeriod, fn: mean, createEmpty: false)
  |> keep(columns: ["_time", "_value"])
  |> rename(columns: {_value: "Outside Temperature"})
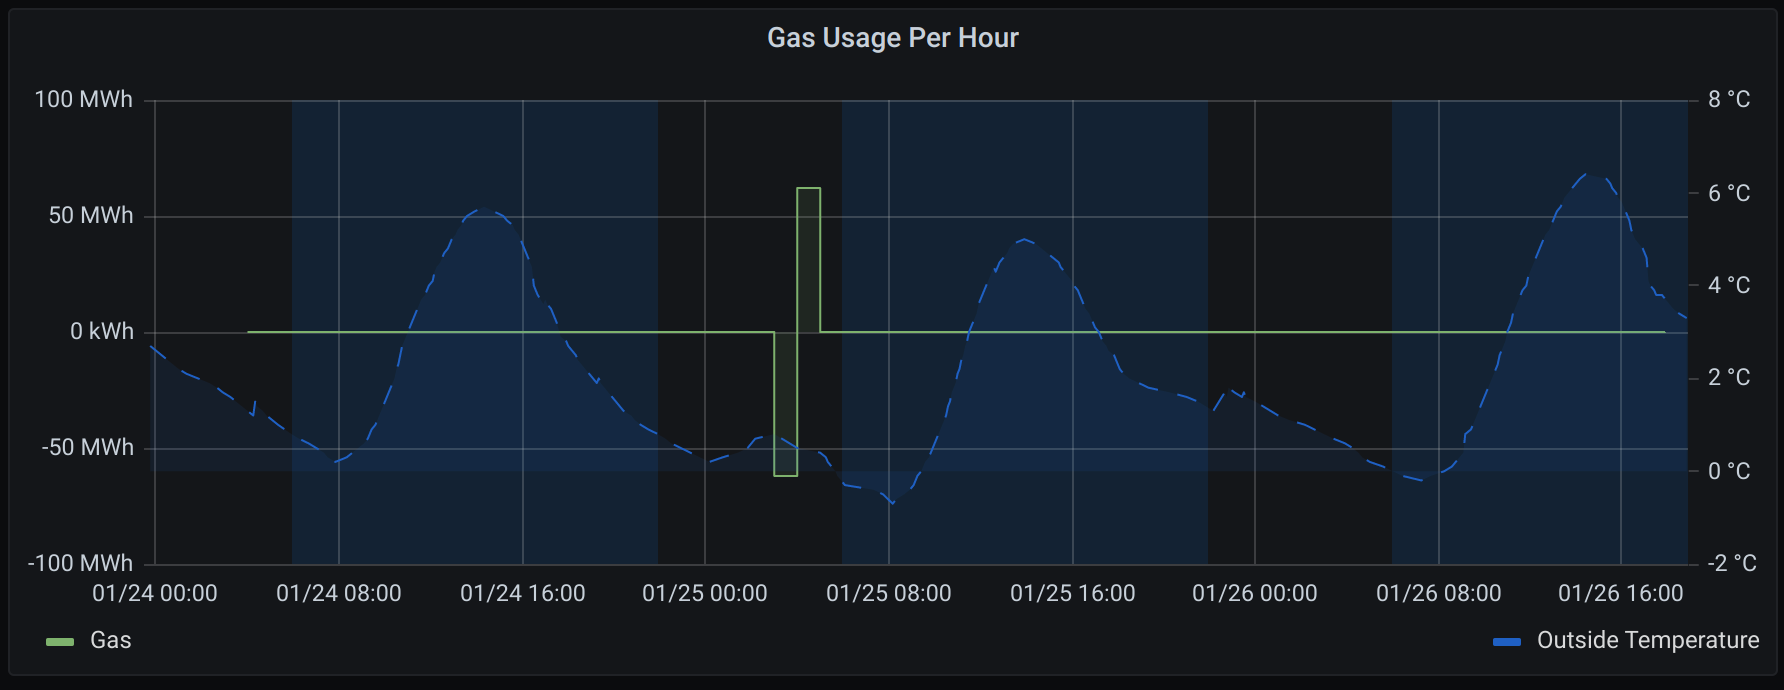
The resulting graph looks like this:
- Gas usage is the green staircased series.
- Outdoor temperature is the dashed blue line.
- The shaded columns represent the hours identify 6am - 10pm each day, just for my ease of “daytime” identification.
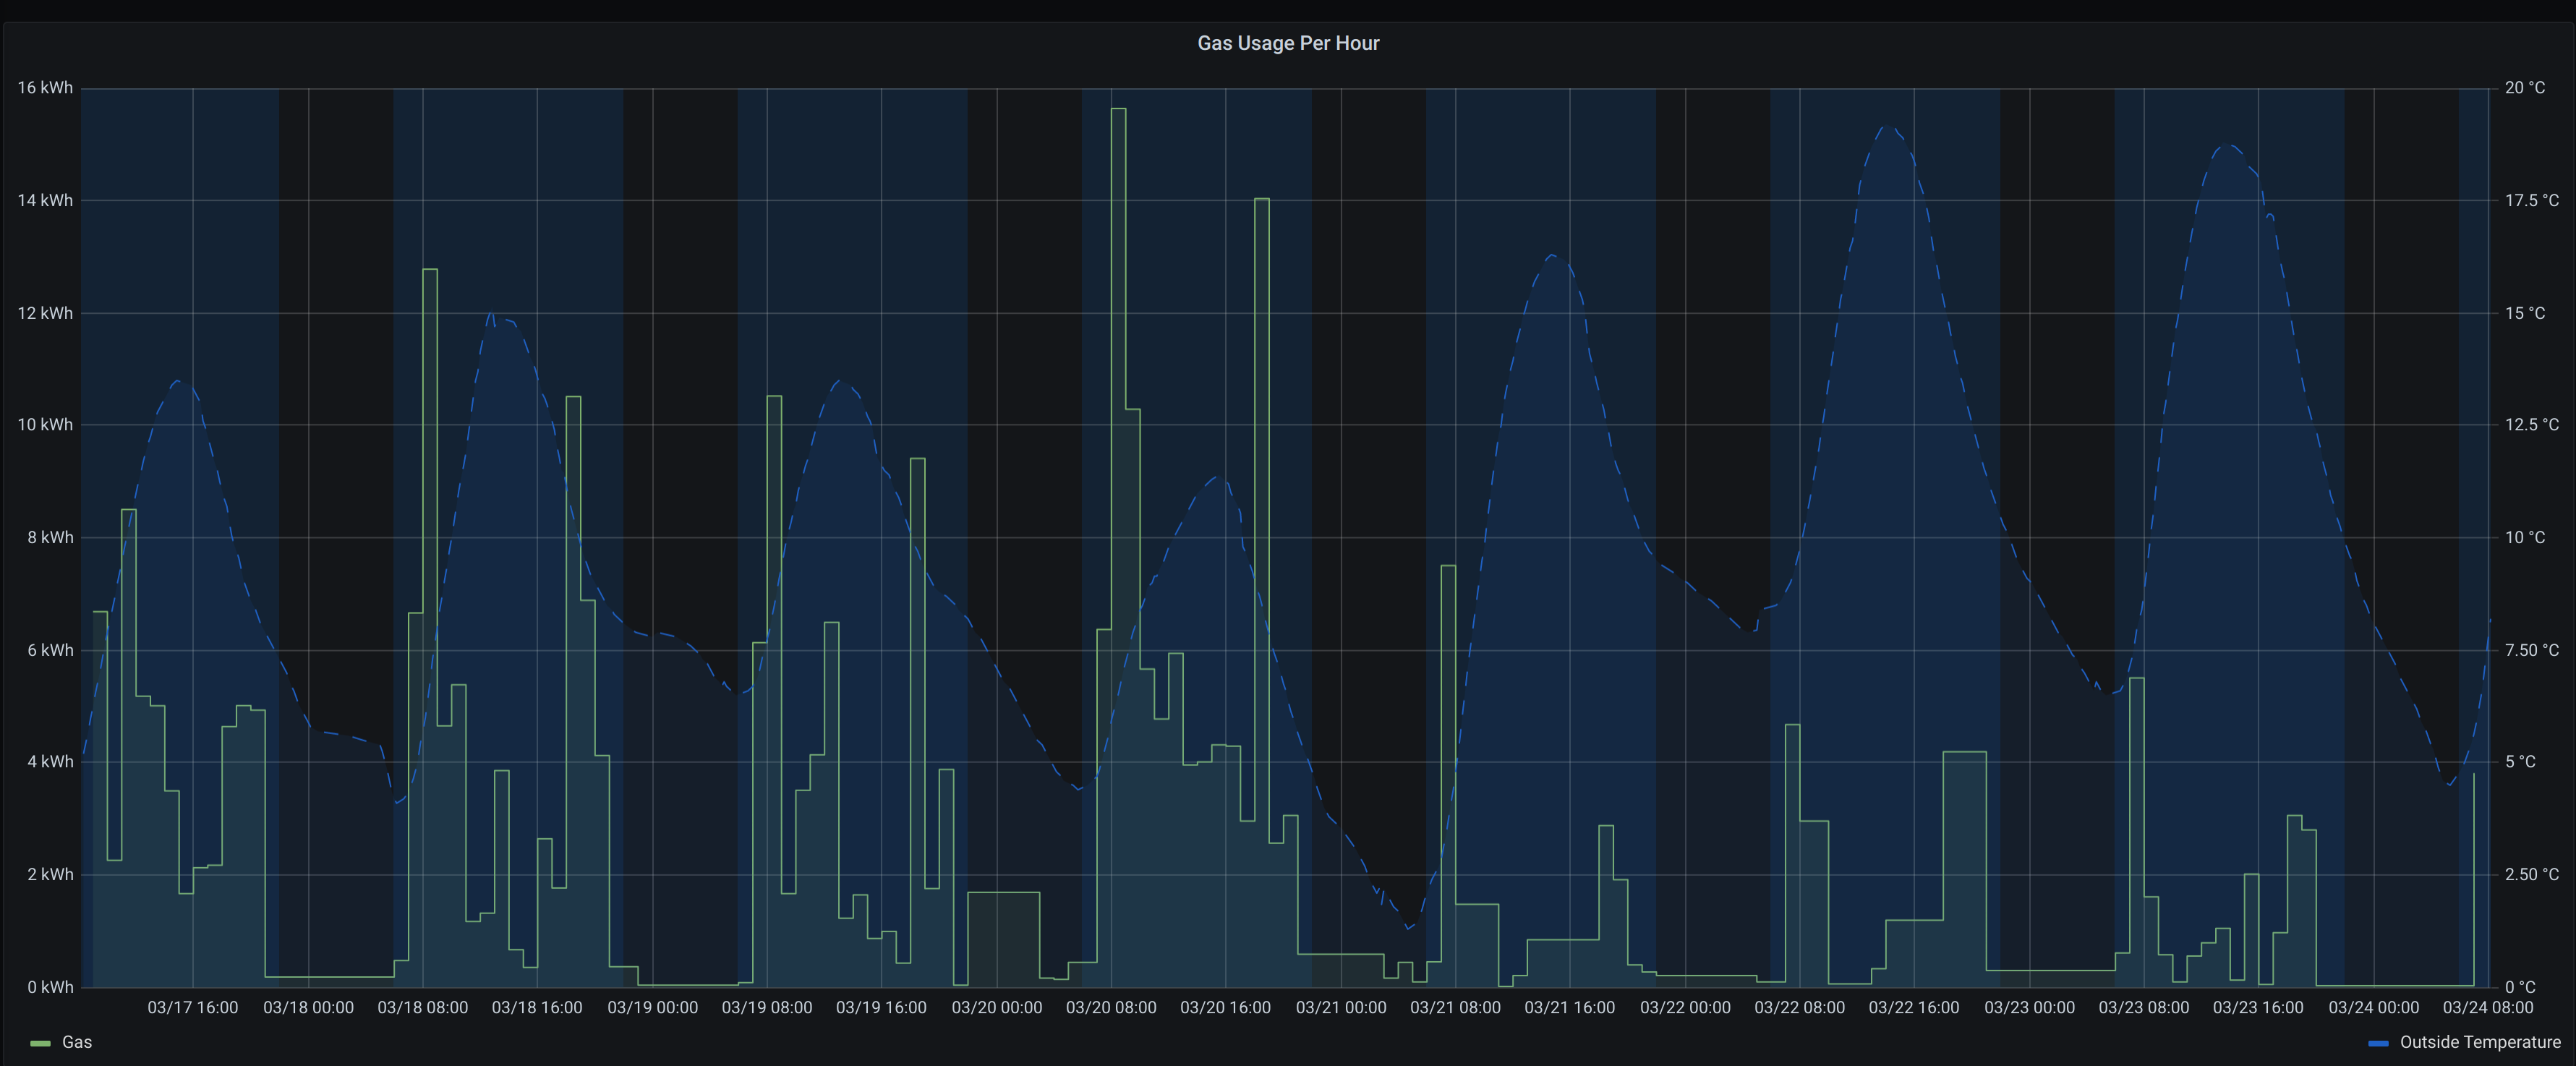
I found this graph really useful. The graph shows that (generally speaking) our gas usage overnight is very low, which is good as we don’t want the boiler using loads of gas when we’re all asleep. Additionally it typically shows much higher usage for 1 - 2 hours at around 7am each day. Of course this coincides with our heating schedule, but I expect this will prove to be a useful tool to tune our schedule to reduce gas usage in the future.
The period shown in the graph shows a significant change in outdoor temperature between the first 4, and last 3 days. Corresponding with this there’s a distinct decrease in gas usage during the warmer days.
Electricity
I wrote a similar Flux query to graph our reported electrical usage:
from(bucket: "energy/autogen")
  |> range(start: v.timeRangeStart, stop: v.timeRangeStop)
  |> filter(fn: (r) => r["_measurement"] == "electricity")
  |> aggregateWindow(every: 1h, fn: last, timeSrc: "_start", timeDst: "_time", createEmpty: false)
  |> difference(nonNegative: false, columns: ["_value"])
  |> keep(columns: ["_time", "_value"])
  |>rename(columns: {_value: "Electricity"})
I didn’t overlay the outdoor temperature data on this graph as it didn’t seem relevant given that our electrical usage doesn’t power any heating devices. The resulting graph looks like this:
- Electrical usage is the green staircased series.
- The shaded columns represent the hours identify 6am - 10pm each day, just for my ease of “daytime” identification.
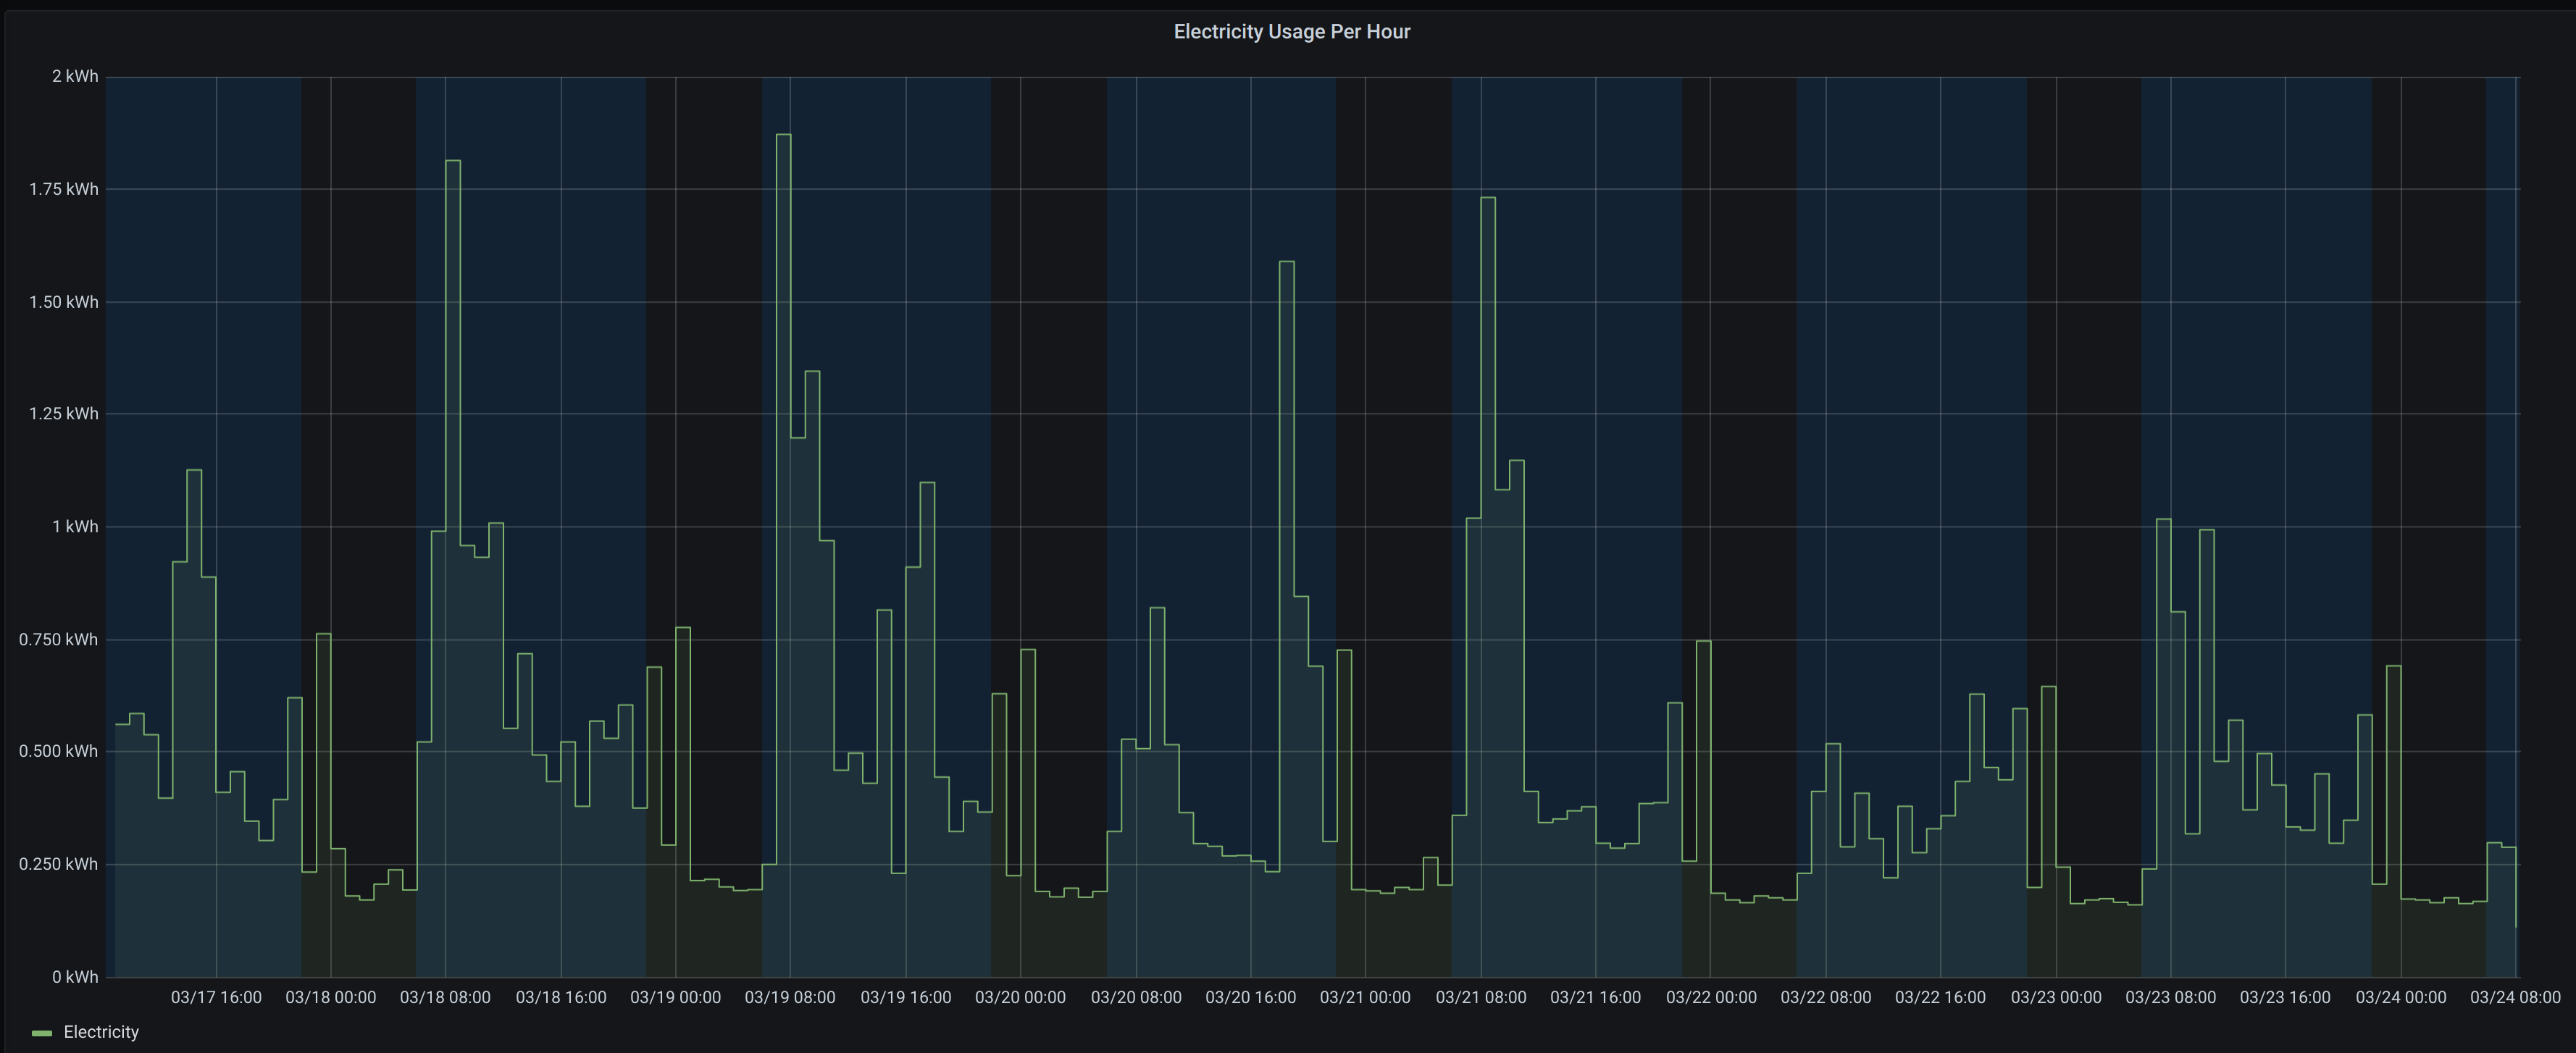
Unlike the gas graph, the electrical graph doesn’t show a particularly strong daily pattern. However it does show our “phantom load (also known as standby power or vampire power), which seems to sit at around 160 - 170 watts. I don’t know how that compares to most for a house and family combination such as ours but it’s a good reminder that devices such as fridges, freezers, dishwashers etc continue to use electricity throughout the night.”
Data Anomalies
Shortly after setting everything up I noticed that my Gas usage graph appeared to have stopped working and was presenting a flat line. On closer inspection it appeared that my meter had emitted 2 changes in gas usage which were so large (minus and plus 62 megawatt hours respectively!) that they made all other readings so small by comparison that the graph appeared flat apart from these 2 readings:
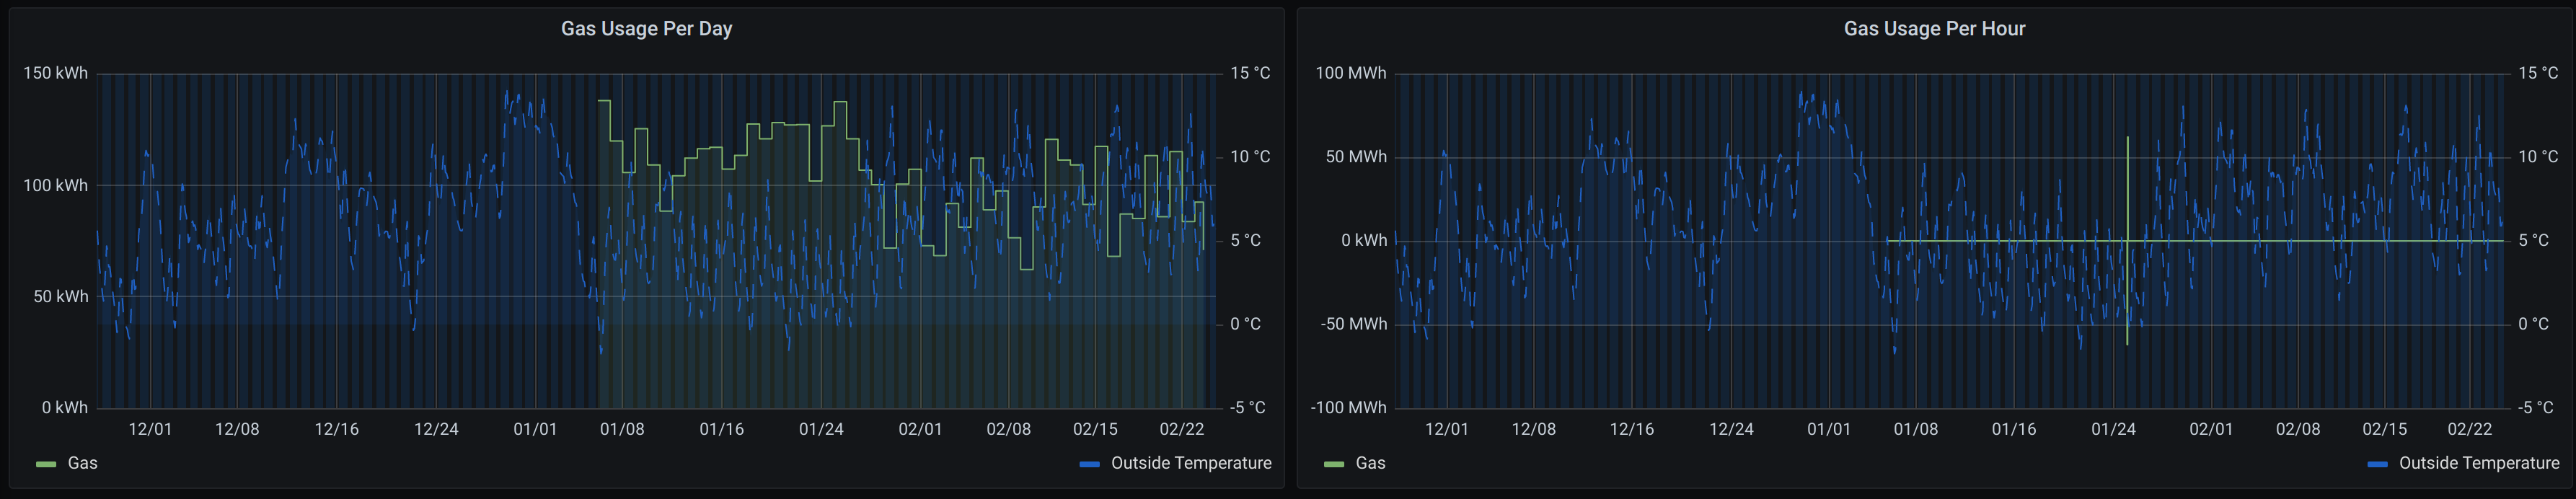
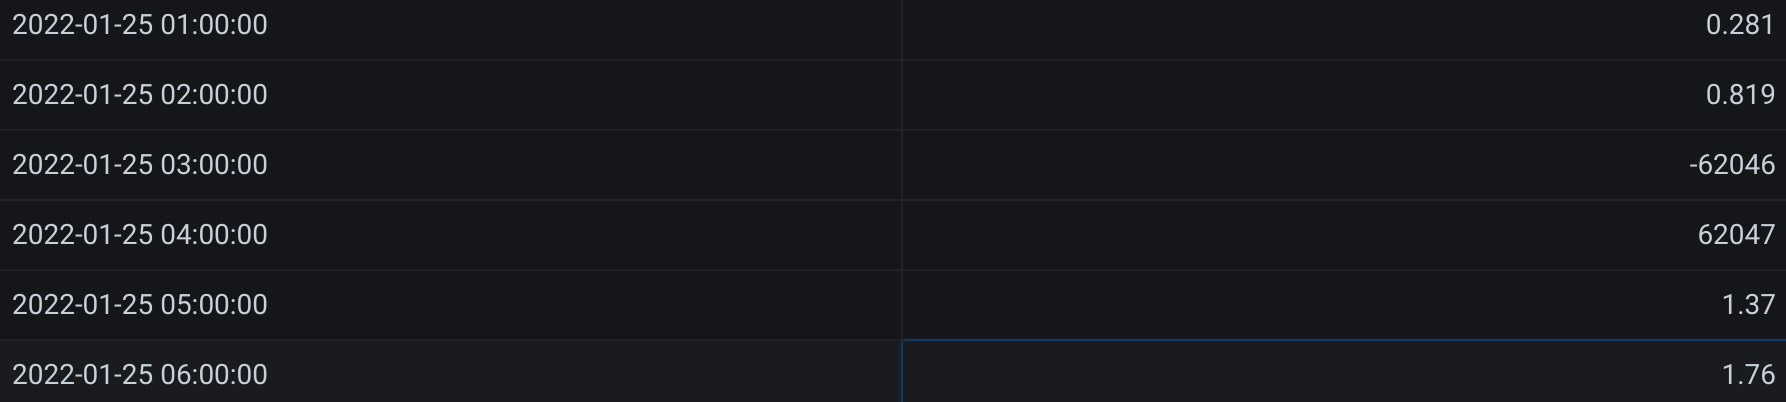
I wondered if this was some sort of understood smart meter behaviour, perhaps a periodic recalibration or reset, so I asked Bulb to explain the behaviour.
Unfortunately Bulb were unable to tell me why this had happened. Part of me wanted to dig my heels in and try and get a clear answer from them, but I didn’t feel like their customer services were going to be forthcoming. Given that the net increase after the 2 huge readings was an increase in 1 kilowatt hour I decided to let it remain a mystery and move on.
Sharing the Code
In case anyone is interested in creating an instance of this app for themselves I have made the code available in my smartthings-bulb-energy-publisher Github repository.
Rather unfortunately, about a week after I finished writing the code I stumbled upon an announcement from Samsung stating that they will be decommissioning the SmartThings Groovy IDE in favour of a new API based replacement. The announcement was made back in June of 2020 and we’re now in the first quarter of 2022, so it looks like they’re behind schedule. But I thought I’d mention this in case anyone gets the app set up and is then disappointed due to Samsung following through with their decommissioning plans.
Feedback
Please leaving a reaction or comment below to let me know if you have found this useful or interesting. I’d love to know if anyone gets the app up and running themselves or if you’ve implemented something similar yourself.
Cheers!
Edd

Enjoyed this? I write this blog for the fun of it — but if a post saved you some time or head-scratching, you can buy me a coffee. It’s about the price of, well, a coffee, takes 20 seconds, and needs no account. It genuinely makes my day.
A handful of lovely readers have already bought me a coffee — thank you, each one's a real treat. ☕